Skip to main content
Main navigation
Home
Media Bulletin
Articles
Contact
Data Vizualization Articles
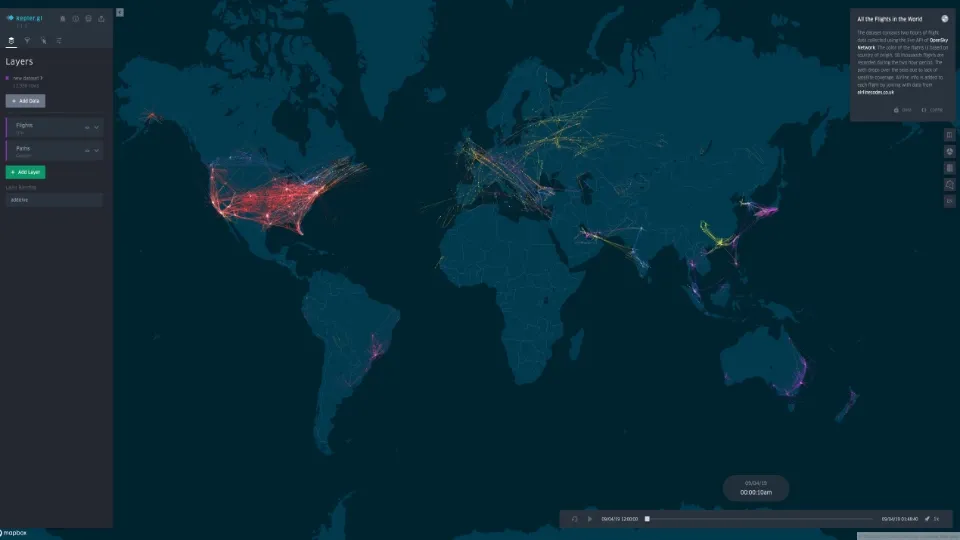
Kepler.gl
Data Vizualization
I
Open Source
I
Project
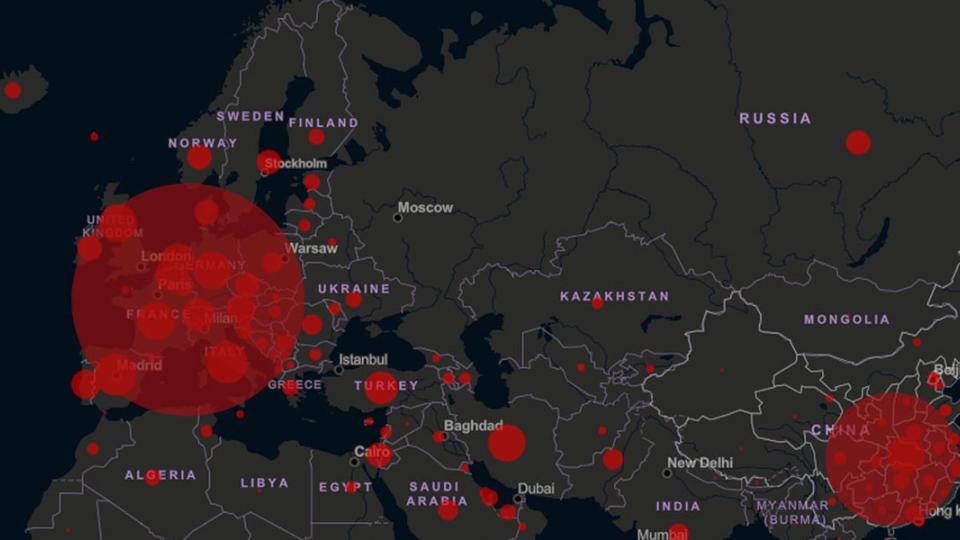
Johns Hopkins
Data Vizualization
I
Project
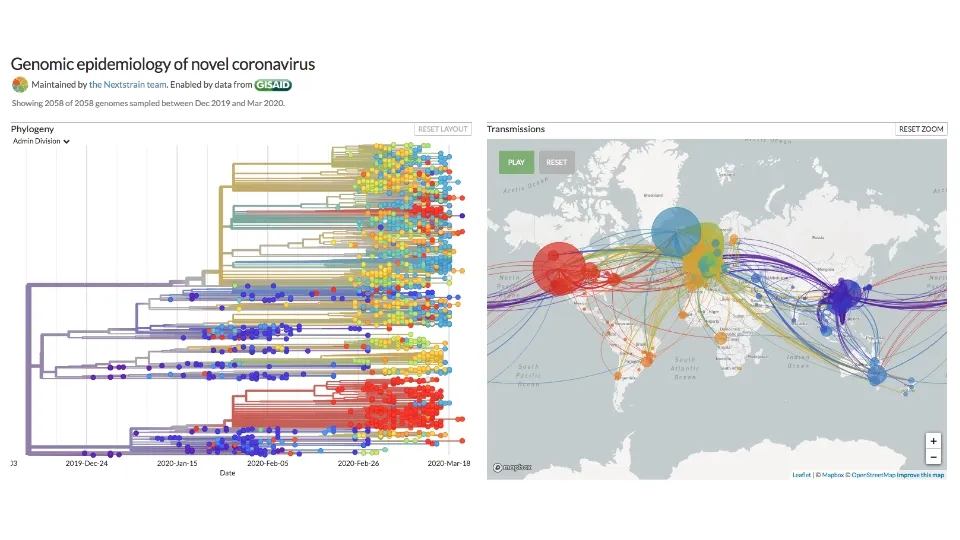
Nextstrain
Data Vizualization
I
Open Data
I
Open Source
I
Project