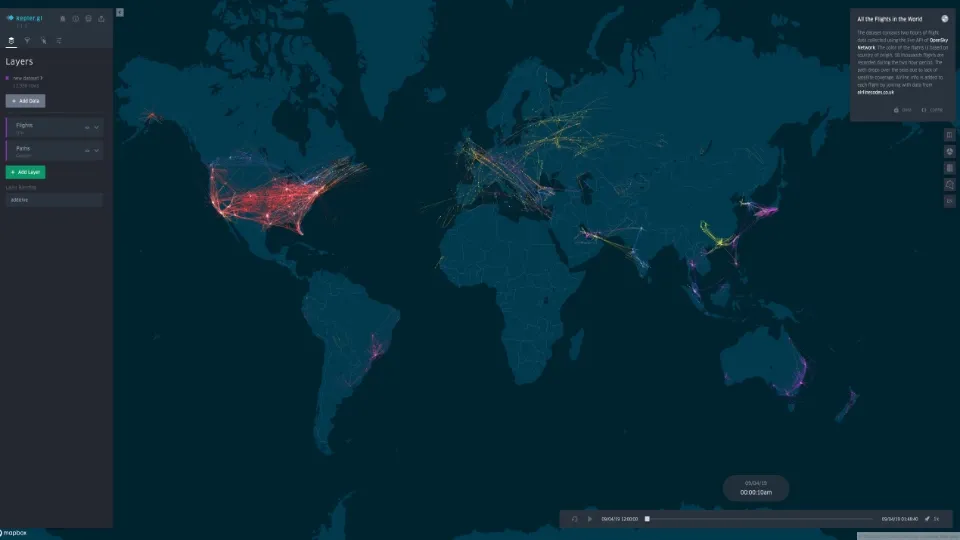
Kepler.gl is an easy-to-use toolbox for geospatial analysis. With kepler.gl, creating data-driven maps becomes a straightforward process. It supports you with powerful and intuitive functionalities to create beautiful data-driven maps and gain quick insights from location data. kepler.gl is built on Deck.gl, which is a WebGL* framework for visual data analysis based on large datasets.
kepler.gl was developed in 2018 by Uber and contributed to the Urban Computing Foundation in 2019. It is distributed under the MIT open source license. kepler.gl is highly customizable, and it can be embedded in applications or used in web browsers.
* WebGL is a JavaScript API for rendering graphics without any plugins and extensions in any modern web browser.
How can this Kepler.gl help me?
Working with kepler.gl is easy for both technical and non-technical users. With kepler.gl, the visualization of large amounts of location data within the web browser or application becomes a straightforward process, helping not merely with visualization but also with gaining insights from data. It comes with various interactive functionalities such as filters and playback over time. In this way, it can be used for visualization and data analysis in different projects with a geospatial context.
To get a first impression and inspiration please have a look at the sample use cases and maps.
How can I use Kepler.gl and what are its benefits?
The easiest way to get started with Kepler.gl is using your web browser. Create your first map in only a few steps. Kepler.gl is a client-side application with no server backend. That means your data lives only on your browser and is not sent to any server.
The usual Kepler.gl workflow is as follows:
- Add data to the map
- Create data layers
- Add filters
- Customize your map settings
- If needed: save your map as an image and export it as a JSON file
For developers: More information on how to embed Kepler.gl in your own application can be found on kepler.gl's GitHub.


